inland empire homes : a fluctuating landscape
Welcome to Inland Empire Homes! Please use this site to gain insights on the latest and historical trends in the Inland Empire real estate market covering both San Bernardino and Riverside counties.
We have broken down the Inland Empire to specific geographic areas and market segments. Please use our data and accompanying reports to understand the dynamics of each area. Our aim is to provide you with insights to the seemingly unpredictable markets, hoping this can benefit you the buyer, seller, investor or renter/lessor .
Riverside/Corona
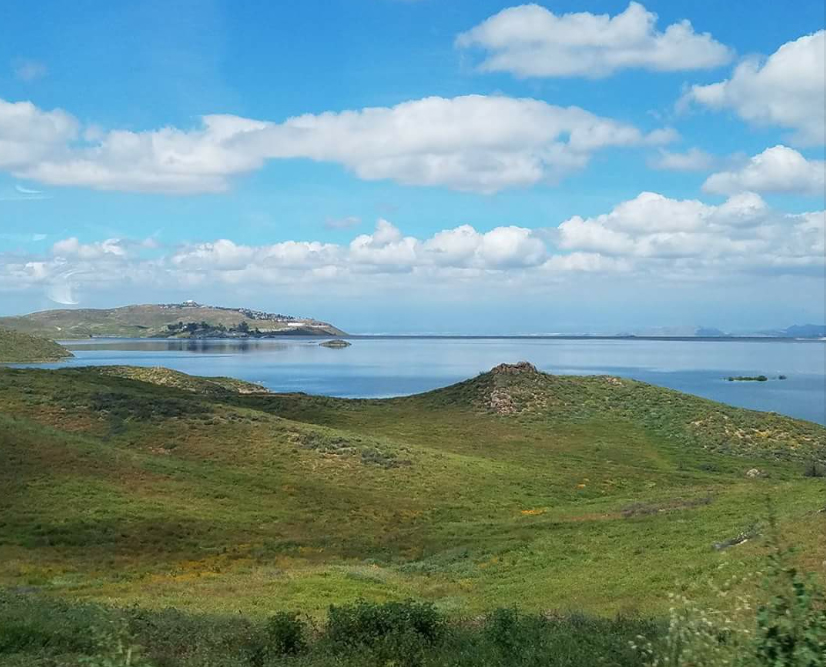
Riverside, Corona, Jurupa Valley, Grand Terrace, Rubidoux, Woodcrest, Norco, Eastvale, Moreno Valley, Perris, San Jacinto , Hemet, Mead Valley, Mira Loma
The top 5 cities/zips in the Riverside/Corona zone that have shown the biggest price hikes in the past year:
City · Zip · pct- san jacinto 92583 $470,000 .088
- perris 92570 $69,4225 .070
- riverside 92506 $787,250 .050
- hemet 92543 $416,900 .044
- riverside 92503 $718,722 .027
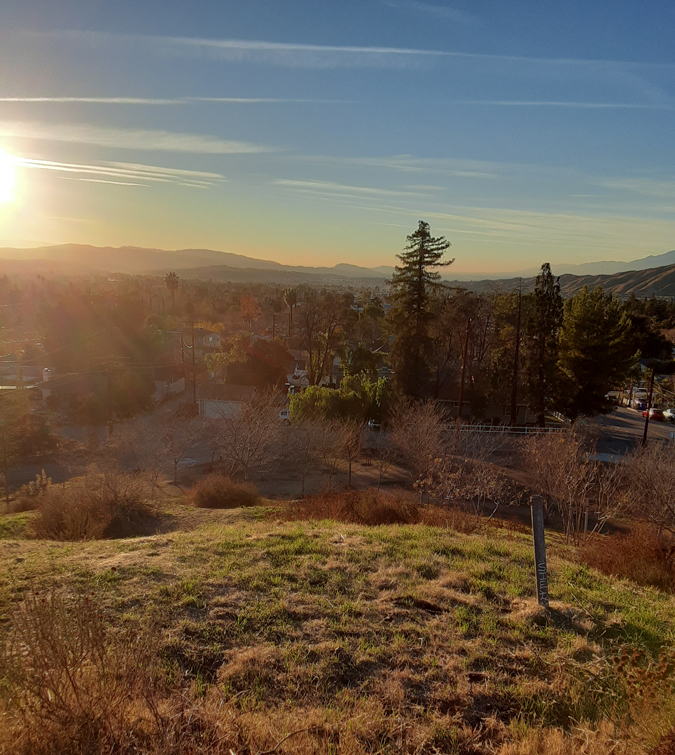
San Bernardino

San Bernardino, Fontana, Colton, Rialto, Loma Linda, Bloomington, Highland, Glen Helen, Devore, Ontario, Rancho Cucamonga
The top 5 cities/zips in the San Bernardino zone that have shown the biggest price hikes in the past year:
City · Zip · pct- san bernardino 92408 $521,225 .061
- chino 91708 $768,250 .053
- san bernardino 92407 $637,438 .050
- bloomington 92316 $673,000 .05
- colton 92324 $527,500 .036
East Hills
Redlands, Mentone, Yucaipa, Cherry Valley, Calimesa, Banning, Beaumont, Big Bear City, Big Bear Lake, Lake Arrowhead, Crestline, Running Springs, Forest Falls, Mountain Home Village, Angelus Oaks, Fawnskin, Oak Glen
The top cities/zips in the East Hills zone that have shown the biggest price hikes in the past year:
City · Zip · pct- cedarpines park 92322 $409,750 .15
- yucaipa 92399 $677,125 .060
- redlands 92373 $935,659 .058
- redlands 92374 $615,000 .002
High Desert
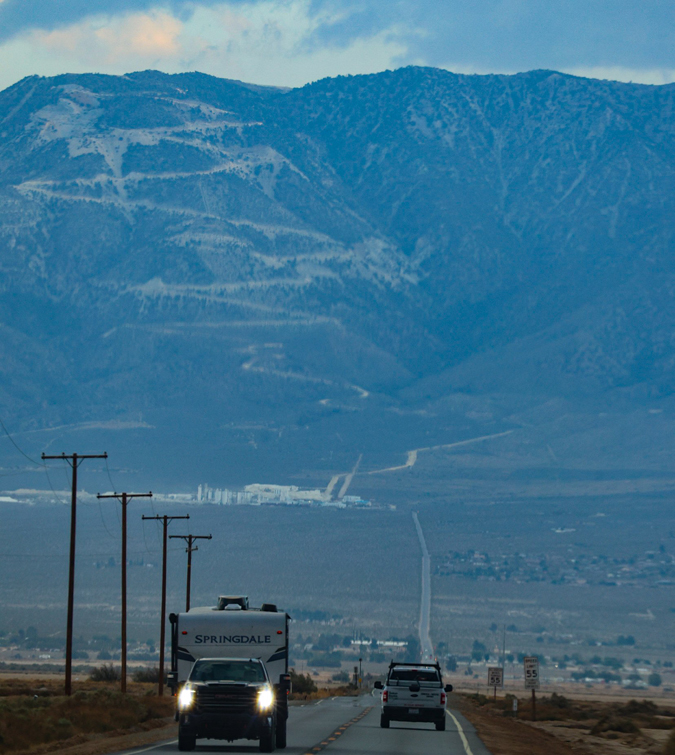
Victorville, Hesperia, Barstow, Apple Valley, Lucerne Valley, Phelan, Adelanto, Pinon Hills, Oak Hills, Helendale, Silver Lakes, Oro Grande, Newberry Springs, Lenwood, Daggett, Yermo, Fort Irwin
The top cities/zips in the High Desert zone that have shown the biggest price hikes in the past year:
City · Zip · pct- apple valley 92308 $454,250 .057
- lucerne valley 92356 $340,000 .054
- pinon hills 92372 $532,250 .054
- victorville 92392 $489,950 .047
- victorville 92394 $449,000 .018
Wine Country
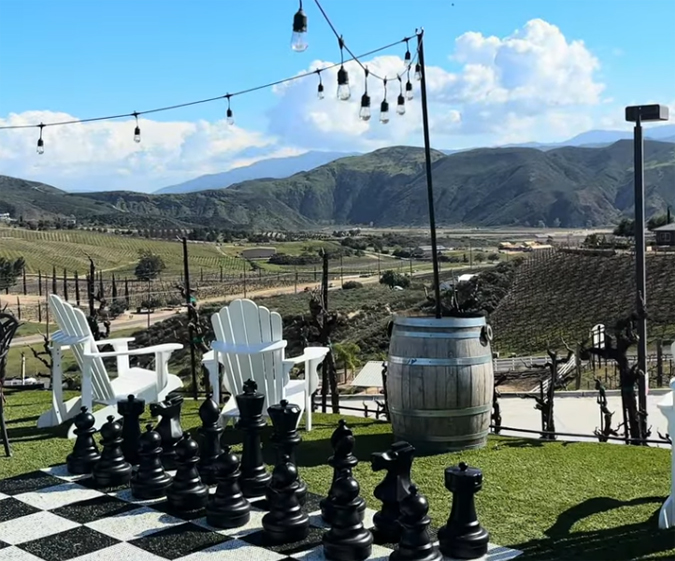
Anza, Sage, Aguanga, Temescal Valley, Winchester, Menifee, Wildomar, Lake Elsinore, Murrieta, Idyllwild, Temecula, Romoland, Nuevo, Homeland, Lakeland Village, French Valley, Canyon Lake
The top 5 cities/zips in the Wine Country zone that have shown the biggest price hikes in the past year:
City · Zip · pct- menifee 92587 $869,500 .174
- temecula 92590 $2,167,250 .084
- anza 92539 $494,500 .075
- nuevo 92567 $609,394 .058
- menifee 92586 $418,500 .029
Palm Springs Valley
Indian Wells, North Palm Springs, Palm Springs, Desert Hot Springs, Palm Desert, Cathedral City, La Quinta, Indio, Coachella, Cabazon, Pioneertown, Yucca Valley, Landers, Joshua Tree, TwentyNine Palms, Morongo Valley, Wonder Valley, Whitewater, Chiriaco Summit, Desert Center, Thermal
The top 5 cities/zips in the Palm Springs Valley zone that have shown the biggest price hikes in the past year:
City · Zip · pct- pioneertown 92268 $1,195,000 .038
- coachella 92236 $562,225 .019
- la quinta 92253 $911,500 .061
- landers 92285 $344,250 .059
- desert hot springs 92241 $662,377 .004